Before you can put the pedal to the metal on scaling your business, you need a reliable way to know if you're even moving. That's where the revenue growth formula comes in. It's less of a complex equation and more of a simple, powerful diagnostic, turning a vague goal like "grow the company" into a hard number you can track and act on.
Think of it as the speedometer for your business. It tells you exactly how fast you're accelerating towards your goals. This one metric cuts through the daily noise—website traffic, social media engagement, email open rates—and gives you a clean, unambiguous snapshot of your company's financial momentum.
Are you cruising along at a healthy clip, or are you stuck in first gear? This single percentage provides the answer, offering critical context for every strategic move you make. It's the starting point for diagnosing what's working, what's not, and where to focus your resources for maximum impact.

How To Calculate Your Growth Rate
Figuring out this crucial KPI is refreshingly simple. All you need are two numbers: your revenue at the beginning of a period and your revenue at the end.
The formula looks like this: Growth Rate = (Current Period Revenue / Prior Period Revenue) – 1
This powerful little calculation is the standard for tracking business performance. It instantly tells you the percentage change in your revenue. To get the percentage, just multiply the result by 100.
Let's walk through it step-by-step:
- Pick Your Timeframe: Decide if you want to look at growth month-over-month, quarterly, or annually. The key is to be consistent so you can make meaningful comparisons later.
- Find Your Starting Revenue: Grab the total revenue figure from the start of your chosen period.
- Find Your Ending Revenue: Now, get the total revenue from the end of that same period.
- Plug in the Numbers: Divide the ending revenue by the starting revenue, and then subtract one. That’s it.
A positive number means you're growing. A negative number means you're shrinking. This single figure is the launchpad for a much deeper analysis into what’s pushing your business forward—or holding it back.
A Real-World Growth Example
Let's make this tangible. Imagine a B2B SaaS company, "ConnectSphere."
At the end of 2023, ConnectSphere's annual recurring revenue (ARR) stood at $2.5 million. After a year of investing in a new content marketing strategy and releasing two major product updates, they closed out 2024 with an ARR of $3.5 million.
Time to apply the formula:
- Prior Period Revenue (2023): $2,500,000
- Current Period Revenue (2024): $3,500,000
- Calculation: ($3,500,000 / $2,500,000) – 1 = 1.4 – 1 = 0.4
Multiply by 100 to get the percentage, and you see that ConnectSphere achieved a 40% year-over-year revenue growth rate.
This isn't just a vanity metric. That 40% becomes a benchmark for their investors, a goalpost for the leadership team, and a proof point that their new marketing strategy is paying off. It's a foundational concept we explore often on the SEO by Tim blog.
Measuring Long-Term Momentum with CAGR
While year-over-year growth gives you a useful snapshot, it can be deceiving. A single fantastic year—perhaps fueled by a one-off viral campaign or a large enterprise deal—can create a misleading spike. Conversely, an unexpected downturn can make your company's performance look far more volatile than it actually is. It's like judging a marathon runner by a single, 100-meter dash; you miss the bigger picture of their endurance and consistency.
To get a clearer view of your business's real trajectory, you need a metric that smooths out those peaks and valleys. This is where the Compound Annual Growth Rate (CAGR) becomes an indispensable tool. CAGR calculates the steady, average growth rate over multiple years, as if the growth had happened at a constant, compounded pace.
This is exactly why seasoned investors and strategic planners lean on it so heavily. They aren't just looking for one blowout year; they want to see the sustainable, underlying engine driving the business forward for the long haul.

Why CAGR Tells a More Honest Story
Imagine a tech startup with this revenue history:
- Year 1: $1.0 million
- Year 2: $3.0 million (a massive 200% growth spurt, thanks to landing a huge Series A funding round and aggressive market expansion)
- Year 3: $3.5 million (growth slows to 16.7% as they focus on product stability and customer support)
- Year 4: $5.0 million (a rebound to 42.9% growth after launching a new enterprise tier)
If you just took a simple average of those annual growth rates, you'd get 86.5%. That number feels inflated and doesn't accurately reflect the company's journey, especially the significant slowdown in Year 3. It's a distorted view that papers over the true, compounded momentum.
CAGR cuts through the noise, providing a more balanced and realistic perspective by focusing only on the starting and ending points over a set period.
Calculating Your Compound Annual Growth Rate
At first glance, the CAGR formula might look a little intimidating compared to a simple growth rate, but it's pretty straightforward once you break it down.
CAGR = (Ending Revenue / Beginning Revenue)^(1 / Number of Years) – 1
Let's apply this to our startup's four-year journey.
-
Pinpoint the Key Values:
- Ending Revenue: $5.0 million
- Beginning Revenue: $1.0 million
- Number of Years: 3 (It's the number of growth periods between Year 1 and Year 4, not the total number of years.)
-
Plug the Numbers into the Formula:
- CAGR = ($5.0M / $1.0M)^(1 / 3) – 1
-
Solve the Equation Step-by-Step:
- First, divide the ending revenue by the beginning revenue: 5.0 / 1.0 = 5
- Next, calculate the exponent: 1 / 3 ≈ 0.333
- Then, raise the result from the first step to the power of that exponent: 5 ^ 0.333 ≈ 1.71
- Finally, subtract 1 from that result: 1.71 – 1 = 0.71
To turn this into a percentage, just multiply by 100. The startup’s CAGR is 71%.
This 71% figure provides a much more sober and accurate picture of the company's growth than the misleading 86.5% simple average. It tells you the steady, consistent annual growth rate the company would have needed to get from $1 million to $5 million over those three years. It smooths out the volatile 200% jump and the 16.7% slowdown, revealing a powerful and much more realistic underlying trend.
The Four Levers That Actually Drive Revenue
Calculating your revenue growth rate tells you the "what"—how fast your business is growing. But to actually influence that number, you need to understand the "how."
This isn't about guesswork. It's about systematically pulling the right levers. Think of your business like a powerful engine. Your growth rate is the reading on the speedometer. These four levers are the components you can tune to get more horsepower and better performance.
Every smart revenue strategy, from a scrappy startup to a Fortune 500 company, boils down to manipulating one of these four drivers. Understanding them is the difference between being a passenger watching the numbers go by and being the driver with your hands firmly on the wheel.
Lever 1: Customer Acquisition
This is the most obvious lever and usually where businesses focus first. Customer acquisition is simply the process of attracting and converting new paying customers. It’s the top-of-the-funnel work that brings fresh blood into your business.
Without a steady stream of new customers, growth eventually flatlines. It’s a non-negotiable.
Actionable Insight: Don't just throw more money at ads. Analyze your channels to find the most profitable source of customers. For example, if your SEO efforts bring in customers with a 25% higher lifetime value than your paid social ads, it's a clear signal to double down on your organic strategy. A B2B software company might boost acquisition by:
- Going all-in on SEO to capture organic traffic from people actively searching for a solution.
- Launching a content campaign that speaks directly to the pain points of their ideal customer.
- Refining their sales demo process to bump up the conversion rate from trial to paid.
Each new customer adds directly to your top-line revenue, making this a direct and powerful lever for growth.
Lever 2: Pricing and Monetization
How you price your product is one of the most powerful decisions you can make, yet it's something many businesses "set and forget." Your pricing is a direct line to your revenue. A small, strategic tweak here can have a massive impact on your bottom line—without needing to land a single new customer.
This isn't just about raising prices across the board. It's about aligning the value you deliver with the price you charge. That could mean restructuring your pricing tiers, introducing a new premium plan, or even shifting from a flat fee to a usage-based model.
A study by Price Intelligently (now ProfitWell) analyzed over 500 companies and found that a 1% improvement in pricing led to an average profit increase of 11.1%. That's a huge return compared to a 1% improvement in acquisition (3.3% profit increase) or retention (6.7% profit increase).
Actionable Insight: Survey your customers. Ask your highest-value users which features they couldn't live without, and ask recently churned customers if price was a factor. This feedback is gold for structuring new, more profitable pricing tiers.
Lever 3: Customer Retention
Here’s a hard truth backed by data from Bain & Company: it can cost 5 to 25 times more to acquire a new customer than to keep an existing one. Customer retention is the art and science of keeping your current customers happy, subscribed, and paying.
When customers leave—a painful reality called churn—you have to sprint twice as fast on the acquisition front just to stay in the same place.
High retention creates a stable, predictable revenue base you can build on. It turns your revenue stream from a leaky bucket into a solid foundation. Actionable Insight: Implement a proactive customer success program. Don't wait for customers to complain. Use product usage data to identify accounts that are disengaging and reach out with helpful resources or training before they think about canceling.
For a deeper look, our guide on calculating Customer Lifetime Value for SaaS shows just how critical retention is to long-term profitability.
Lever 4: Expansion Revenue
The final lever, expansion revenue, is where the fastest-growing companies truly separate themselves from the pack. It’s about generating more income from the customers you already have. This is how you grow with your customers by upselling, cross-selling, and adding new value.
Also known as Net Revenue Retention (NRR) or "negative churn," expansion revenue is one of the strongest signs of a healthy business. When the extra revenue from existing customers outpaces the revenue you lose from churn, your business can grow even if you don't sign a single new client.
Real-life example: Slack excels at this. A team might start on a free or basic plan. As they grow and rely more on the tool, they upgrade to a paid plan for more features (upsell). Then, they might purchase integrations with other tools or add-ons like Slack Connect for external collaboration (cross-sell).
By focusing on these four levers, you can build a much more robust and predictable growth engine. While acquisition gets all the headlines, true, sustainable growth comes from a balanced strategy that optimizes pricing, keeps customers for the long haul, and constantly finds new ways to deliver more value to them over time.
Applying The Formula in SaaS and eCommerce
The core revenue growth formula gives you the "what"—a simple percentage. But its real magic comes alive when you apply it to the unique physics of your business. The levers you pull to grow a recurring-revenue SaaS company are completely different from those in a transaction-based eCommerce store. One size definitely does not fit all.
In the world of Software-as-a-Service (SaaS), growth is about building a predictable, compounding stream of income. The metrics that feed your growth formula are tied to recurring revenue and customer longevity.
An eCommerce business, on the other hand, lives and dies by the individual transaction. While repeat business is crucial, the immediate focus is often on maximizing the value of each purchase and increasing the number of visitors who click "buy."
A Worked Example for SaaS Growth
Let's look at a fictional B2B SaaS company, "Data-Driven," and see how they calculate growth in a single quarter. Their North Star metric is Monthly Recurring Revenue (MRR).
- Starting MRR (January 1st): $50,000
- New MRR from new customers: $10,000
- Expansion MRR (upsells from existing customers): $5,000
- Churned MRR (lost from cancellations): -$3,000
To find the net change, the formula is: New MRR + Expansion MRR – Churned MRR.
For Data-Driven, that's $10,000 + $5,000 – $3,000 = $12,000 in net new MRR.
So, their Ending MRR (March 31st) becomes $50,000 + $12,000 = $62,000.
Now, we plug that into the revenue growth formula:
($62,000 / $50,000) – 1 = 0.24 or 24% growth for the quarter.
This deeper look reveals something powerful: 58% of their net growth came from signing up new customers, but a hefty 42% came from their existing customer base. This is a classic SaaS lesson—mastering both acquisition and retention is the only way to build sustainable growth. If you're looking to fuel that acquisition engine, our guide on SEO for SaaS companies has some great strategies.
A Worked Example for eCommerce Growth
Now, let’s switch gears to an eCommerce brand, "Modern Threads," and compare its Q1 performance to Q2.
For a business like this, we're focused on transactional drivers: Total Orders and Average Order Value (AOV).
- Q1 Revenue: 5,000 orders * $80 AOV = $400,000
- Q2 Revenue: 6,000 orders * $85 AOV = $510,000
Using the same standard revenue growth formula:
($510,000 / $400,000) – 1 = 0.275 or 27.5% quarterly growth.
When we break it down, we see the growth came from two places. They saw a 20% jump in the total number of orders and a 6.25% increase in how much people spent per order. This is a clear sign that their efforts to both attract more buyers (perhaps through a successful influencer marketing campaign) and encourage bigger cart sizes (by introducing product bundles) are paying off.
This infographic lays out the primary levers—pricing, acquisition, retention, and expansion—that any business can pull to influence its revenue.
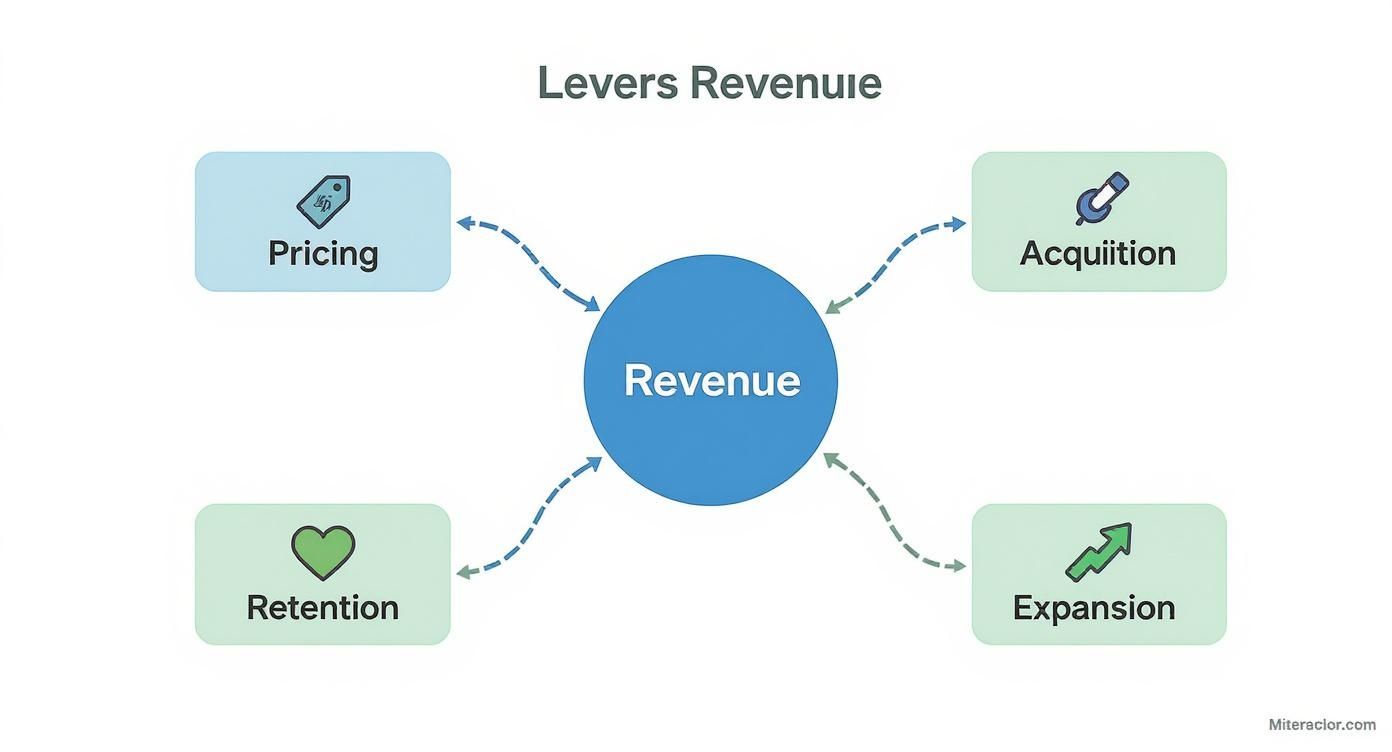
As you can see, while every business has these core drivers, the strategic focus shifts dramatically depending on the business model.
Revenue Growth Drivers SaaS vs eCommerce
The following table breaks down the primary metrics and strategic levers used to calculate and influence revenue growth in SaaS and eCommerce business models.
| Metric/Lever | SaaS (Subscription-Based) | eCommerce (Transaction-Based) |
|---|---|---|
| Primary Revenue Unit | Monthly/Annual Recurring Revenue (MRR/ARR) | Revenue per Transaction |
| Key Growth Metric | Net Revenue Retention (NRR) | Customer Lifetime Value (CLV) |
| Acquisition Focus | Acquiring new subscribers, lead generation | Driving traffic, conversion rate optimization (CRO) |
| Retention Focus | Reducing customer churn, increasing user engagement | Encouraging repeat purchases, loyalty programs |
| Expansion Focus | Upsells to higher tiers, cross-sells to new products | Increasing Average Order Value (AOV), product bundles |
| Pricing Strategy | Tiered pricing, usage-based, per-seat models | Product-level pricing, discounts, shipping fees |
Ultimately, understanding which levers matter most for your specific model is the difference between simply tracking growth and actively driving it.
Strategic Differences and Industry Context
The fundamental difference really comes down to the unit of growth. SaaS companies grow by adding customer accounts and increasing their recurring value. eCommerce companies grow by increasing the number and value of individual transactions.
For SaaS, the holy grail is positive Net Revenue Retention (NRR). This is where the expansion revenue from your existing customers is greater than the revenue you lose to churn. When you hit that, your company can grow even if you don't sign a single new customer. For eCommerce, a similar long-term goal is increasing Customer Lifetime Value (CLV) to make sure what you spend to acquire a customer pays off many times over.
It's also critical to view your growth rate in the context of your industry. A "good" growth rate isn't universal. Historical data compiled by NYU Stern is pretty eye-opening here. Over a 34-year period, the automotive industry saw a Compound Annual Growth Rate (CAGR) of around 8.37%. Meanwhile, the software and services sector has often blown past 15-20% during strong economic cycles. You can explore more of the historical growth data from NYU Stern yourself.
This is why just plugging numbers into a formula isn't enough. You need a nuanced understanding of your business model's mechanics and your industry's benchmarks. By breaking the formula down into its core components—whether that's MRR and churn or AOV and order volume—you can finally move from just measuring growth to strategically engineering it.
How to Forecast Future Revenue Accurately
Good forecasting is what separates the leaders who make things happen from the managers who watch things happen. It’s all about turning your revenue growth formula from a backward-looking report card into a forward-looking roadmap. This is how you build financial models that stand up to scrutiny, whether you're fundraising, planning your next big move, or just setting goals that are both ambitious and achievable.
When you have solid historical data, you can start projecting future performance with real confidence. The two best ways to do this are with bottom-up and top-down forecasting. Each gives you a completely different, yet equally valuable, lens on your growth potential.
The Bottom-Up Forecasting Method
Think of bottom-up forecasting like building a house one brick at a time. You start with the smallest, most tangible pieces of your business—your sales pipeline, lead flow, conversion rates, and your team's actual capacity. From there, you build up to a realistic revenue projection. It’s a forecast firmly rooted in the reality of your day-to-day operations.
This approach essentially asks, "Based on what we can control and measure right now, what's the most revenue we can realistically generate?"
Actionable Example: A SaaS business knows its marketing team generates 500 qualified leads per month and the sales team has a historical 3% lead-to-customer conversion rate. That's 15 new customers monthly. If the average revenue per user (ARPU) is $200, they can build a bottom-up forecast of $3,000 in new MRR each month. You can learn more about how to analyze historical revenue for accurate projections and put those insights to work.
This method is incredibly credible because every number is tied to a real-world activity. It's the perfect tool for setting operational targets and managing your team's performance.
The Top-Down Forecasting Method
If bottom-up is about laying individual bricks, top-down forecasting is like drawing the blueprint for the entire city first. This method kicks off from the 30,000-foot view: the Total Addressable Market (TAM). That’s the entire revenue opportunity available for a product or service like yours. From that massive number, you work your way down.
You estimate what slice of that pie you can realistically capture over a certain timeframe. Here’s how it looks in practice:
- Identify TAM: The global market for your type of software is $10 billion.
- Estimate Market Share: You believe your company can realistically capture 0.5% of this market over the next three years.
- Calculate Projected Revenue: Your target revenue becomes $50 million ($10 billion * 0.005).
Investors and VCs love this approach because it shows you understand the competitive landscape and proves the sheer scale of the opportunity. It answers the big question: "Just how big can this business get?"
The only catch? It can sometimes feel completely disconnected from the hard work of actually winning that market share. A huge TAM means nothing if you don't have a concrete plan to capture it. This is precisely why many businesses that embrace a revenue-driven SEO strategy use both forecasting methods to keep their big-picture goals tied to operational reality.
Why a Hybrid Approach Is Best
The most bulletproof forecasts don't just pick one method. They blend the bold ambition of the top-down view with the nuts-and-bolts practicality of the bottom-up model.
By building both a top-down and a bottom-up forecast, you create a powerful system of checks and balances. The bottom-up forecast keeps your goals grounded, while the top-down forecast ensures you aren’t thinking too small.
What happens if your bottom-up forecast is way lower than your top-down projection? That’s not a failure—it's a critical strategic insight. It shines a spotlight on the gap between your ambition and your current capabilities.
This gap tells you exactly where you need to invest. Maybe you need to hire more salespeople, pump more money into your marketing budget, or focus on improving your product's conversion rates. It gives you a clear path to closing that gap and turning those big market-share goals into a reality.
Common Mistakes When Measuring Growth
Nailing a revenue growth formula is the easy part. The real challenge—and where most people trip up—is actually understanding what the numbers are telling you. Get the interpretation wrong, and even the most accurate formula can send you down a rabbit hole of bad strategy and missed opportunities.
Let’s walk through the common traps that even seasoned pros can fall into. Think of this as your sanity check to make sure the story your numbers are telling is the truth, not just a convenient fiction.
Confusing Revenue with Profitability
This is easily the most dangerous mistake you can make: celebrating top-line growth while your bottom line is bleeding out. A revenue chart pointing straight up looks fantastic in a presentation, but if your costs are climbing even faster, you're not building a business—you're just lighting cash on fire.
Real-life example: In the early 2000s, many dot-com companies like Pets.com showed staggering revenue growth. However, they were spending unsustainable amounts on marketing and logistics, resulting in massive losses that ultimately led to their collapse. They chased revenue at all costs, ignoring profitability.
Actionable Insight: Always analyze revenue growth alongside your profit margins and Customer Acquisition Cost (CAC). Is your growth profitable? Healthy, sustainable growth is the only kind that matters in the long run.
Chasing Vanity Metrics
It's tempting to get excited about big, flashy numbers. But not all metrics are created equal. Vanity metrics, like total user sign-ups or social media followers, feel great to report but often have a weak connection to actual revenue.
A SaaS company might pop the champagne for hitting 100,000 free trial sign-ups. But if only 1% of them ever convert to a paid plan, that big number is just masking a massive product-market fit or conversion problem.
Actionable Insight: Get ruthless about tracking metrics that directly impact revenue. Instead of fixating on total users, obsess over Paid Conversion Rate, Customer Lifetime Value (LTV), and Net Revenue Retention (NRR). These are the metrics that speak directly to financial health. It's a lot like the SEO world, where you have to figure out if branded search volume is a real ranking signal or just another distraction.
Ignoring Seasonality and Context
Finally, a growth percentage without context is meaningless. A retailer that sees a 200% revenue spike between October and December isn't necessarily a marketing genius—that's just the holiday shopping season. Likewise, comparing a blockbuster Q4 against a notoriously slow Q1 will always paint a skewed picture.
To get a true read, you have to compare apples to apples.
- Year-over-Year (YoY) Growth: This is your go-to. Compare this quarter's performance to the same quarter last year to cancel out seasonal noise.
- Trailing Twelve Months (TTM): Looking at a rolling 12-month window helps smooth out any wild monthly swings and shows you the real, underlying trend.
Steering clear of these common blunders will help you use your revenue formulas as a reliable compass, not a broken one.
Frequently Asked Questions
You've got the formulas down, but putting them into practice is where the real questions pop up. Let's tackle some of the most common ones I hear from clients.
What Is a Good Revenue Growth Rate?
Honestly, "good" is all about context. It's a classic "it depends" answer, but for good reason.
A venture-backed, early-stage startup might aim for the "triple, triple, double, double, double" (T2D3) growth path, meaning they triple their revenue for two years, then double it for the next three. That's a phenomenal rate. But for a well-established company in a mature market, hitting a consistent 20-30% growth is a massive win.
The smartest move is to look at your peers. A B2B SaaS company is going to have a completely different benchmark than a traditional manufacturing firm. Your stage and industry define what "good" looks like for you.
How Often Should I Measure Revenue Growth?
The right cadence really depends on the pulse of your business.
- Monthly: This is non-negotiable for fast-paced models like SaaS. You need to keep a close eye on your Monthly Recurring Revenue (MRR) to make quick, informed decisions.
- Quarterly: This is the standard for most businesses. It’s the perfect interval for checking in on strategic goals and reporting back to investors or other stakeholders.
- Annually: Looking at the full year helps you see the bigger picture. It smooths out any seasonal bumps and gives you a clear view of your long-term trajectory.
How Do I Interpret a Negative Growth Rate?
Seeing your growth rate dip into the negative can be alarming, but don't panic. A negative number is just a signal, a flashing red light telling you to look under the hood.
All it means is that you're losing more revenue from churned customers than you're gaining from new and existing ones. It’s a diagnostic tool. Your job is to trace the problem back to one of the core growth levers—acquisition, pricing, retention, or expansion. Find the leak, and you can start to patch it.
Ready to turn these formulas into a predictable growth engine for your business? At SEO by Tim, we specialize in revenue-focused SEO that connects your strategy to bottom-line results. Book a free discovery call to see how we can help you scale.
Article created using Outrank