At its core, calculating LTV in SaaS is straightforward: take your Average Revenue Per Account (ARPA) and divide it by your customer churn rate. But to get a truly accurate picture, you need to factor in your gross margin. This isn't just about crunching numbers; it's about turning a simple revenue figure into a powerful predictor of your company's long-term health.
Why LTV Is Your Most Important SaaS Metric
Before we get buried in formulas, let’s talk about why Customer Lifetime Value (LTV) is so much more than another metric on your dashboard. It’s your strategic compass. It doesn't just report on what happened last quarter; it helps predict future revenue and guides every major decision you make.
A solid grasp of LTV tells you exactly how much you can afford to spend to acquire a new customer—the heart of the all-important LTV:CAC ratio. Without this insight, your marketing spend is just a shot in the dark. For example, HubSpot uses its LTV:CAC ratio to decide when to scale its sales teams. If the ratio exceeds 3:1, it’s a green light to hire more aggressively, confident that each new rep will generate a profitable return.
The Strategic Impact of LTV
For any SaaS business, understanding LTV is fundamental. It shifts your focus from short-term revenue spikes to building sustainable, profitable customer relationships. This is the perspective that separates companies like Adobe, with its predictable subscription revenue, from those that burn through cash with no clear path forward.
Consider the case of a B2B project management tool I advised. They were pouring their budget into paid social ads, celebrating a low Cost Per Lead. On the surface, things looked great. But when we dug into the LTV, we found that these customers, typically freelancers, churned within three months and had a tiny lifetime value of $150. In contrast, users coming from organic search—primarily small agencies—had an LTV of nearly $2,500. That single insight led to reallocating 70% of the ad budget into a content strategy targeting higher-value agency clients. This is where things get interesting, as organic success depends on many factors, including the impact of branded search volume as a ranking signal, which can show how well your brand resonates with high-value users.
LTV isn't just a metric; it's a diagnostic tool. A low or declining LTV is an early warning sign of deeper issues, such as poor product-market fit, an ineffective onboarding process, or a flawed pricing strategy.
A Quick Guide to LTV Calculation Methods
To help you navigate the rest of this guide, it's useful to have a high-level view of the different ways we can calculate LTV. Each method has its place, depending on your company's stage and the data you have on hand.
Here’s a quick summary to help you pinpoint the right approach for your business.
Quick Guide to SaaS LTV Formulas
| LTV Formula Type | Calculation Method | Best For |
|---|---|---|
| Simple LTV | (ARPA / Customer Churn Rate) x Gross Margin % | Early-stage startups needing a quick, directional metric. |
| Predictive LTV | Uses historical data and behavioral patterns to forecast future value. | Businesses with established data looking for more accurate forecasting. |
| Cohort-Based LTV | Groups customers by sign-up period to track value over time. | Mature companies wanting to identify trends and segment customers. |
Getting familiar with these approaches is the first step. By picking the right one for your situation, you can transform LTV from a passive number into actionable intelligence that truly drives your business forward.
The Foundational Formula for SaaS LTV
Alright, let's get down to the brass tacks of calculating LTV. Moving beyond theory and into the actual math is where the insights really start to pop. We'll start with the foundational formula—it's a quick and powerful way to get a snapshot of what a customer is worth to you.
This whole calculation really boils down to three core metrics that, frankly, every SaaS business should be tracking like a hawk. Getting these numbers right is everything; garbage in, garbage out.
- Average Revenue Per User (ARPU): This is simply the average revenue you earn from a customer over a set period, usually monthly or annually. It's the top-line value each user brings in.
- Gross Margin %: Not all revenue is created equal. Your gross margin is the profit left after you subtract the direct costs of delivering your service (often called Cost of Goods Sold, or COGS). For SaaS, this typically includes things like AWS hosting fees, third-party API costs from tools like Twilio, and the portion of your customer support team's salaries dedicated to existing customers.
- Customer Churn Rate: This is the percentage of customers who cancel their subscriptions in a given period. It's the nemesis of growth and a direct reflection of how well you’re keeping people happy.
Assembling the LTV Equation
The magic happens when you bring these three numbers together. The most common and straightforward formula for LTV is to simply divide your margin-adjusted ARPU by your churn rate. What this does is project the total profit you can expect to make from an average customer over their entire time with you.
The classic way to write this out is: LTV = (ARPU x Gross Margin %) / Churn Rate.
Let’s use a real-world scenario. A SaaS company like Buffer, which offers social media scheduling tools, might have a monthly ARPU of $50 for one of its plans. Let's assume a healthy 70% gross margin and a monthly churn rate of 4%. Their gross profit per customer each month is $35 ($50 × 70%). Divide that by their churn rate (0.04), and you get an LTV of $875. If you want to dig deeper into the nuances, we've got a full breakdown of how to master customer lifetime value in SaaS on sparkco.ai. You can see right away how tightly these metrics are linked.
A Practical LTV Calculation in Action
Let's walk through a more realistic example. Imagine a B2B SaaS startup providing HR software with these monthly numbers:
- ARPU: $150
- Gross Margin: 80%
- Monthly Churn Rate: 5%
First, we need to find the actual gross profit per customer each month. Remember, it's not the full $150; it's what you pocket after your service delivery costs.
$150 (ARPU) x 0.80 (Gross Margin) = $120 (Monthly Gross Profit Per User)
Next, that 5% monthly churn rate tells us that the average customer sticks around for 20 months (1 / 0.05). So, we can plug that into our LTV formula.
$120 (Monthly Gross Profit) / 0.05 (Churn Rate) = $2,400 (LTV)
That one number, $2,400, is a goldmine of information. It tells you exactly how much profit you can expect from the average new customer, which is the figure you'll use to decide how much you can afford to spend to acquire them.
Key Takeaway: The quality of your LTV calculation lives and dies by the quality of your data. Using blended averages for different customer segments or fuzzy churn numbers will give you a dangerously misleading LTV. Always fight for clean, segmented data.
The Outsized Impact of Improving Churn
This is where LTV stops being a simple metric and becomes a strategic weapon. Let's revisit our HR startup and see what happens if they pour resources into customer success and manage to reduce their monthly churn from 5% down to 4%. It's just a one-percentage-point drop.
The ARPU ($150) and Gross Margin (80%) haven't changed, so the monthly gross profit per user is still $120.
But look at what happens to the LTV:
$120 (Monthly Gross Profit) / 0.04 (New Churn Rate) = $3,000 (New LTV)
By cutting churn by just 1%, the company boosted its LTV by $600—a massive 25% jump in the value of every single new customer. This is a perfect illustration of why retention is the most powerful growth engine in SaaS. For example, by focusing on improving the first-week onboarding experience, GrooveHQ famously reduced its churn by 71%, directly multiplying its LTV.
Making Your LTV Actionable: The All-Important LTV to CAC Ratio
Calculating your Customer Lifetime Value is a huge step, but the number itself doesn't tell the whole story. An LTV of $5,000 sounds great until you realize it costs you $6,000 to acquire that customer. This is where the LTV to Customer Acquisition Cost (CAC) ratio comes into play. It's arguably the single most important health metric for any SaaS business.
The LTV:CAC ratio answers a beautifully simple question: For every dollar we spend to get a customer, how many dollars do we get back? It’s the ultimate measure of your sales and marketing efficiency and, frankly, the sustainability of your entire business model.
The 3-to-1 Rule: SaaS Gold Standard
In the SaaS world, the unofficial gold standard for a healthy LTV:CAC ratio is 3:1. This means you generate $3 in lifetime value for every $1 you spend on acquisition. This 3x return gives you enough cushion to cover your cost of goods sold (COGS), pay for all your operating expenses, and still turn a decent profit.
- A ratio hovering around 1:1 is a red alert. You’re essentially losing money on every new customer once you factor in operational costs. This often happens to startups that scale paid advertising too quickly before achieving product-market fit.
- A ratio significantly higher than 3:1, say 5:1 or more, is fantastic news. However, it can sometimes be a sign that you’re not investing aggressively enough in growth. Atlassian, known for its low-touch, high-LTV model, has historically maintained a very high ratio, demonstrating extreme efficiency.
The LTV:CAC ratio is your North Star for sustainable growth. It moves the conversation from "how many customers did we get?" to "how many profitable customers did we get?"—which is a much more important question to answer.
Industry LTV:CAC Ratios: A Comparative Benchmark
Of course, "good" is relative. What's exceptional in one SaaS niche might be average in another. It's incredibly helpful to see how your numbers stack up against others in your space.
The table below breaks down some typical LTV:CAC ratios across different SaaS sectors, based on recent data.
| SaaS Sector | Average LTV | Average CAC | LTV:CAC Ratio |
|---|---|---|---|
| Adtech | $6,800 | $956 | 7:1 |
| Marketing Tech | $5,200 | $1,040 | 5:1 |
| Fintech | $4,500 | $1,125 | 4:1 |
| E-commerce SaaS | $3,800 | $950 | 4:1 |
| Business Services | $3,150 | $1,050 | 3:1 |
| Industrial SaaS | $2,900 | $967 | 3:1 |
As you can see, sectors like Adtech often show incredibly efficient acquisition models, while others operate closer to the 3:1 baseline. You can discover more insights about these SaaS benchmarks on eqvista.com. Understanding where you fit in helps set realistic goals for your own sales and marketing engine.
The infographic below shows how the core metrics we've discussed feed into the LTV side of this crucial ratio.
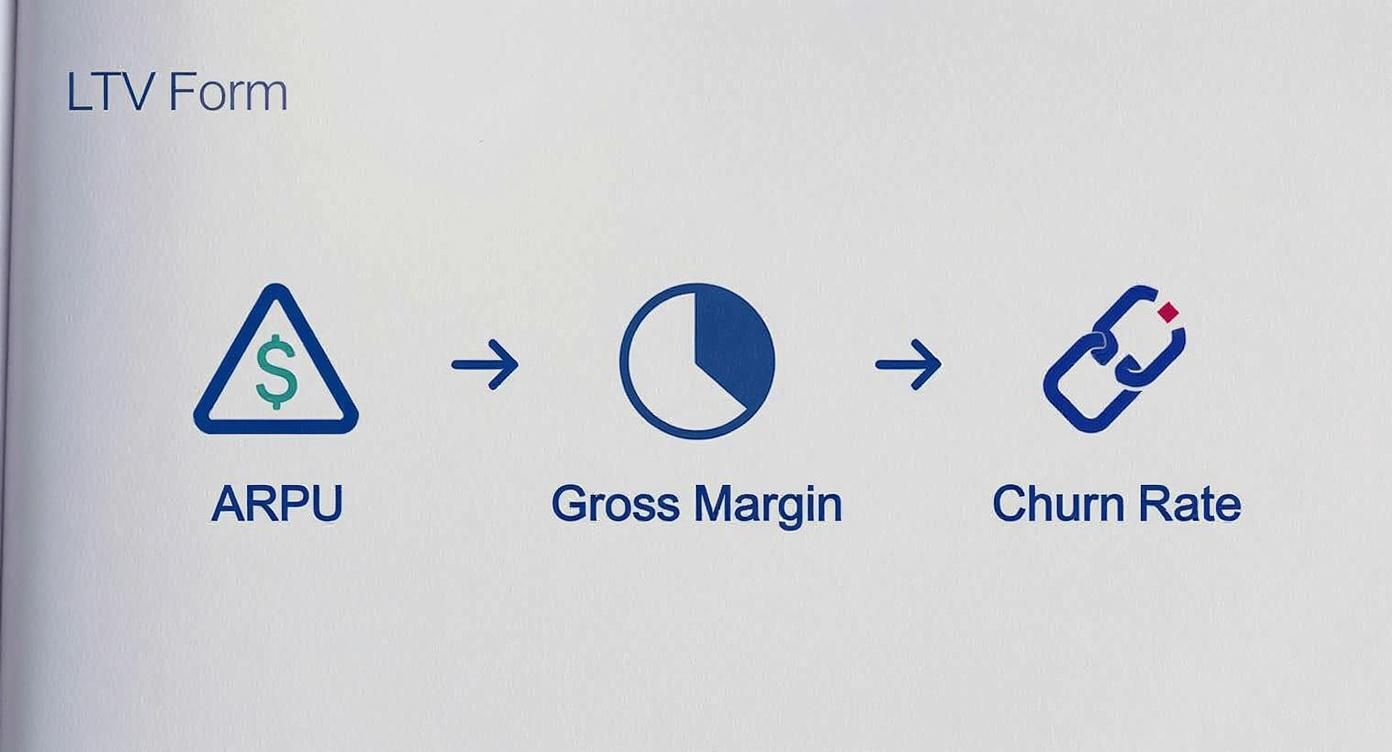
This visual flow is a great reminder that ARPU, Gross Margin, and Churn Rate are the foundational inputs for calculating LTV, which in turn allows you to figure out your all-important LTV:CAC ratio.
How to Improve Your LTV to CAC Ratio
If your ratio isn't where it needs to be, don't panic. You have two main levers to pull: increase LTV or decrease CAC. The most effective strategies usually tackle a bit of both.
Here are a few proven ways to start moving the needle in the right direction:
- Optimize Your Pricing: This is often the lowest-hanging fruit. For instance, pricing software company ProfitWell found that a simple 1% improvement in price optimization can boost profits by over 11%. Can you add a new premium tier, create valuable add-ons, or adjust your usage-based pricing?
- Obsess Over Retention: As we saw earlier, a tiny improvement in churn can have an outsized impact on LTV. Pour resources into your customer success and support teams, streamline your onboarding, and act on user feedback before it becomes a reason to cancel.
- Double Down on Your Best Channels: Not all acquisition channels are created equal. Dig into your data to see which ones deliver customers with the highest LTV. It's often better to invest more in what works—like a revenue-driven SEO strategy that attracts high-intent users—and cut back on channels with a low LTV-to-CAC profile.
- Fuel Expansion Revenue: Your existing customers are your best source of new revenue. Slack is a master of this; as teams grow, they naturally add more seats, increasing their LTV without any new marketing spend. Make it easy for customers to upgrade (upsell) or buy complementary products (cross-sell).
Using Advanced LTV Models for Deeper Insights
As your SaaS business picks up steam, relying on a single, blended LTV number becomes a real liability. It’s like trying to navigate a city with a map of the entire country—it points you in a general direction but completely hides the street-level details you need to make smart moves.
To get a real feel for your business dynamics, you have to move past the basic formula and start using more advanced LTV models. These aren't just about getting a more accurate number; they're about uncovering the story behind your revenue. They help you see which customers are really driving growth, how product updates affect loyalty over time, and where your biggest expansion opportunities are hiding.
Diving Deep with Cohort Analysis
One of the most powerful ways to calculate LTV in SaaS is through cohort analysis. It’s a simple but game-changing idea: instead of lumping all your customers together, you group them by when they signed up. Think "January 2024 cohort," "February 2024 cohort," and so on. This simple act of grouping unlocks a goldmine of information.
When you track each cohort's revenue and retention month by month, you start to see undeniable patterns. Did the March cohort, who experienced your new, streamlined onboarding flow, stick around 15% longer than the February group? Is the LTV of customers acquired from a Q4 sponsorship lower than the ones who found you organically in Q1?
A blended churn rate can easily mask serious problems. You might see a "healthy" 3% average churn and think you're doing great. But cohort analysis could show that while your enterprise clients are rock-solid at 1% churn, your SMB clients are leaving at a disastrous 8%. Without cohorts, you'd be flying blind.
This approach turns LTV from a static report card metric into a dynamic diagnostic tool. It lets you measure the real-world impact of your product changes, pricing experiments, and customer success efforts on long-term value.
The Challenge of Negative Churn
Once your product really starts clicking with customers, you might run into a wonderful problem: negative churn. This is the holy grail for any SaaS company. It happens when the expansion revenue from your existing customers—through upgrades, add-ons, or more seats—is greater than the revenue you lose from cancellations. For instance, Snowflake famously has a Net Revenue Retention rate over 150%, meaning the average existing customer spends 50% more one year later.
The thing is, negative churn completely breaks the simple LTV formula. Your churn rate becomes a negative number, and the math suddenly suggests your customers have an infinite LTV. As great as that sounds, it’s not exactly something you can take to the bank.
This is where more sophisticated models become absolutely essential. They need to be able to account for this growth. The best LTV calculations factor this in, especially when you start breaking down customers by type. For instance, a high-value client cohort generating $1,200 in Annual Recurring Revenue (ARR) with an 80% gross margin and a five-year expected lifetime can have an LTV of $4,800. Meanwhile, a lower-tier group might only come out to $240. You can explore more on these advanced SaaS LTV calculations on growthequityinterviewguide.com.
Segmenting LTV for Strategic Clarity
Beyond just grouping by sign-up date, the real strategic magic happens when you segment LTV by customer attributes. Lumping your $10/month self-serve users in with your $5,000/month enterprise clients gives you an LTV that represents neither of them. It's a useless average that leads to bad marketing spend and misguided product roadmaps.
Start slicing your LTV calculations by the things that actually drive your business. You’ll get a much sharper picture of what’s really going on.
- By Customer Plan/Tier: What’s the LTV of a "Pro" plan customer versus a "Basic" one? This tells you which plans are attracting and keeping your most valuable users.
- By Acquisition Channel: Do customers from organic search have a higher LTV than those from paid ads? This is critical for optimizing your marketing budget and calculating a channel-specific LTV:CAC ratio.
- By Company Size (SMB vs. Enterprise): Enterprise customers almost always have lower churn and much higher expansion potential, leading to a wildly different LTV. Knowing these numbers justifies entirely different go-to-market strategies for each segment.
Imagine a marketing automation platform discovers its enterprise LTV is $120,000, while its SMB LTV is only $3,000. That knowledge is a green light to build a dedicated sales team for big deals while relying on a low-touch, automated funnel for the SMB market. Segmenting LTV isn't just about better math—it's the foundation of a smarter, more targeted business strategy.
Practical Tools and Templates for LTV Calculation
Knowing the formulas is one thing, but actually putting them to work is where you start seeing the real value. Moving from a theoretical understanding of LTV to actively calculating it for your own business really just comes down to having the right tools. The good news is you don't need some complex, expensive business intelligence suite to get started.
This section is all about getting you the practical resources to start your calculations today, whether you're most comfortable in a spreadsheet or ready to query your database directly.
https://www.youtube.com/embed/eHi875QuVcA
Your Go-To LTV Spreadsheet Template
For a lot of founders and marketers I know, a well-organized spreadsheet is the command center for all their key metrics. It’s accessible, pretty easy to update, and perfect for modeling out different "what-if" scenarios. To make this as painless as possible, we’ve built a template you can copy and use right away.
This spreadsheet comes with pre-built formulas for both the simple LTV calculation and a more detailed cohort-based analysis. All you have to do is plug in your own data.
Here’s a quick look at the template, showing a sample cohort analysis in action.
As you can see, this view tracks the cumulative ARPU for your January and February customer cohorts over several months. It gives you a crystal-clear picture of how their value is compounding over time.
Sourcing Your Data
The old saying "garbage in, garbage out" has never been more true. The accuracy of your LTV calculation depends entirely on the quality of the data you feed it. Your key metrics—ARPU, churn, and gross margin—are probably spread across a few different platforms.
Here’s where you should start looking:
- Payment Processors (Stripe, Braintree): This is ground zero for your revenue data. Most have built-in analytics that can give you MRR, churn rates, and ARPU. Stripe Billing, for instance, has incredibly detailed subscription metrics that are perfect for this.
- Subscription Management Platforms (Chargebee, Recurly): If you use a tool like Chargebee or Recurly, it’s your single source of truth for all things subscription-related. They often have dedicated LTV reports and cohort analysis features baked right in, which can save you a ton of time.
- Customer Relationship Management (CRM) Systems (HubSpot, Salesforce): Your CRM is a goldmine for segmenting LTV. You can pull data on customer size, industry, or acquisition channel to slice your LTV calculations and uncover much deeper insights. For example, is LTV higher for customers who came from organic search versus paid ads? Your HubSpot or Salesforce data can tell you.
A Quick Tip from Experience: When you're pulling these numbers, be consistent. If you use monthly ARPU and a monthly churn rate for one calculation, don't mix in annual data somewhere else. Consistency is the secret to creating a reliable LTV metric that you can actually compare over time.
Querying Your Database with SQL
If you're an analyst or a more technical founder who's comfortable with raw data, SQL is your best friend. Running a query directly against your production database gives you complete control and the most granular data you can possibly get.
This approach lets you join your user, subscription, and payment tables to get surgically precise numbers, which is especially powerful for doing a proper cohort analysis.
Below is a sample SQL query I've put together to pull the necessary pieces for calculating LTV from a typical SaaS database. I’ve commented it heavily to explain what each part does, so you can adapt it to your own table structure.
— This query calculates Monthly Recurring Revenue (MRR),
— active customers, and ARPU for each month.
SELECT
DATE_TRUNC('month', s.start_date)::DATE AS month,
— Calculate total monthly revenue from active subscriptions
SUM(p.monthly_price) AS mrr,
— Count the number of unique active customers
COUNT(DISTINCT s.customer_id) AS active_customers,
— Calculate Average Revenue Per User (ARPU)
SUM(p.monthly_price) / COUNT(DISTINCT s.customer_id) AS arpu
FROM
subscriptions s
— Join with a plans table to get pricing information
JOIN
plans p ON s.plan_id = p.id
WHERE
— Filter for subscriptions that are currently active
s.status = 'active'
GROUP BY
1 — Group by the month
ORDER BY
1; — Order results chronologically
This query gives you a clean, month-by-month breakdown of your MRR and active customer count, which gets you the ARPU figure you need for the LTV formula. You can easily build on this foundation—for example, by comparing active customer lists month-over-month to calculate churn—and get all the raw ingredients for an accurate LTV calculation straight from the source.
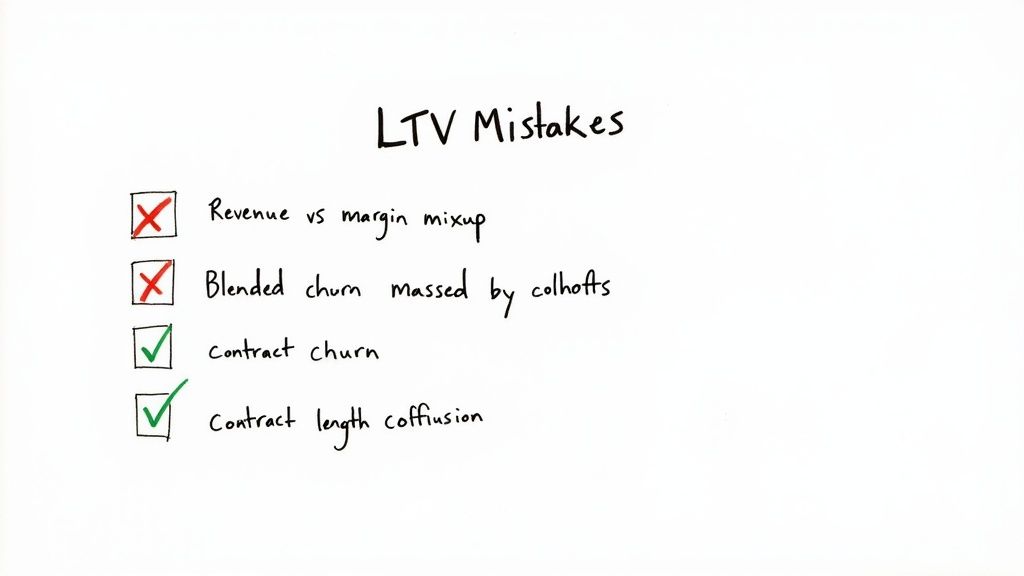
Common LTV Calculation Mistakes (And How to Avoid Them)
Calculating LTV isn’t just about plugging numbers into a formula. I've seen firsthand how an inaccurate LTV can lead to terrible strategic decisions, like blowing the budget on the wrong acquisition channels or misjudging the fundamental health of the business. An LTV that's wrong is far more dangerous than having no LTV at all.
Even tiny missteps in your inputs can throw your final number way off. The goal here is to steer you clear of those subtle but costly errors I see teams make all the time.
Confusing Revenue with Gross Margin
This one is probably the most common—and damaging—mistake. It’s tempting to just take your Average Revenue Per User (ARPU), divide it by your churn rate, and call it a day. But that number doesn't account for the real cost of delivering your service.
This inflates your LTV, giving you a false sense of security and a dangerously high ceiling for what you think you can spend on Customer Acquisition Cost (CAC).
Imagine your ARPU is $200, but your gross margin is only 60% after you factor in things like hosting, support team salaries, and third-party software licenses. If you calculate LTV using the full $200, you're setting yourself up for a nasty surprise when you realize you're spending money you don't actually have.
- How to fix it: Always, always start with your gross margin. Subtract your Cost of Goods Sold (COGS) from your revenue before it ever touches an LTV formula. This ensures every decision is grounded in actual profit, not just top-line revenue.
Using a Blended Churn Rate
A single, company-wide churn rate is a vanity metric. It hides more than it reveals. As we saw with cohort analysis, a blended number often masks a leaky bucket in one segment while being propped up by the loyalty of another.
A blended churn rate tells you what's happening, but segmenting it tells you why. It's the difference between seeing a fever and knowing the source of the infection.
You might be celebrating a "healthy" blended churn of 3%. But what if you dug in and found that customers on your starter plan are churning at 10% a month, while your enterprise clients are rock-solid at 0.5%? That’s a completely different story, and it tells you exactly where to focus your retention efforts.
Ignoring Different Contract Lengths
Another classic oversight is lumping all your customers together, regardless of their contract term. Monthly and annual subscribers behave very differently, and treating them as one group will absolutely skew your LTV.
Annual subscribers are gold. They pay you upfront (hello, cash flow!) and tend to stick around much longer. For example, say 30% of your customers are on annual plans with a 5% annual churn, while the other 70% are on monthly plans with a 4% monthly churn. Averaging them out just doesn't work.
- How to fix it: Calculate LTV for your monthly and annual customers as two separate segments. This gives you a much clearer picture of your business. It also highlights the true value of incentivizing customers to make that jump to an annual contract.
- Once you have the LTV for each segment, you can create a weighted average if you need a single, more accurate company-wide LTV.
Your SaaS LTV Questions, Answered
As you start to put these LTV calculations into practice, a few common questions always seem to pop up. Let's tackle them head-on, drawing from what we've already covered.
How Often Should I Be Calculating LTV?
For most SaaS businesses, running the numbers on LTV monthly is the sweet spot. This cadence gives you enough data to see real trends taking shape without drowning you in day-to-day noise.
Now, if you're in a rapid growth spurt or running a bunch of marketing experiments, you might want to switch to a weekly calculation. This gives you a much faster feedback loop to see what’s really moving the needle.
What’s a Good LTV for a SaaS Company?
This is the million-dollar question, but the truth is, there's no magic number. A "good" LTV is completely relative. An LTV of $5,000 could be fantastic for a product aimed at small businesses, but it would be a major red flag for an enterprise-level platform.
The metric that truly matters here is your LTV to CAC ratio. You should be aiming for at least a 3:1 ratio. This is the classic benchmark for a healthy SaaS business, signaling that for every dollar you spend to acquire a customer, you're getting three dollars back over their lifetime.
Is It Possible to Calculate LTV for a Pre-Revenue Startup?
You bet. It won't be based on historical data, of course, but it’s a crucial forecasting exercise. You'll need to make some smart, well-researched assumptions.
Here’s what you’ll need to project:
- Average Revenue Per User (ARPU): Base this on the pricing tiers you plan to launch.
- Customer Churn Rate: Look up industry benchmarks for similar products and customer segments to get a reasonable starting point. For example, a B2B SaaS targeting SMBs might start with a 5-7% monthly churn assumption.
- Gross Margin: Forecast what your cost of goods sold (COGS) will be to deliver your service. A typical cloud-based SaaS might aim for an 80-90% gross margin.
Even though it’s an estimate, this projected LTV is invaluable. It’s a core component of your financial model and a key metric for showing potential investors that you have a viable business on your hands.
Ready to turn search into a reliable growth engine for your SaaS? SEO by Tim delivers revenue-focused SEO that scales with your business. Book a free discovery call to build your growth strategy at https://seobytim.com.
Article created using Outrank